Summary of results
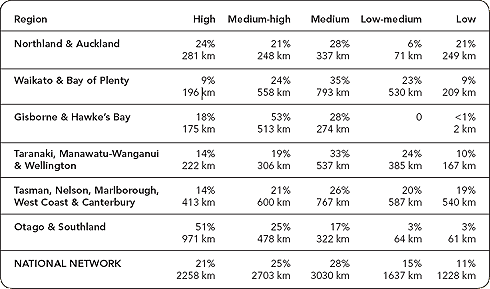
The Collective Risk and Personal Risk tables show the results for each region. The results illustrate what percentages and how many kilometres of the state highway network fall within the five risk categories.
Collective Risk

* Percentages may not add to 100% due to rounding
Personal Risk
* Percentages may not add to 100% due to rounding
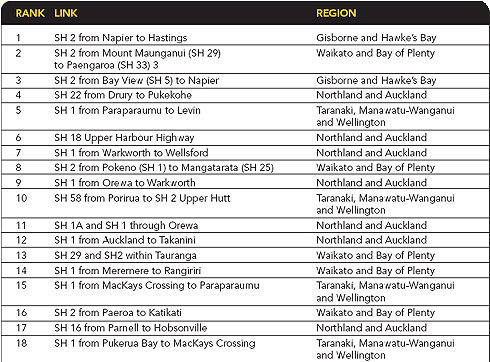
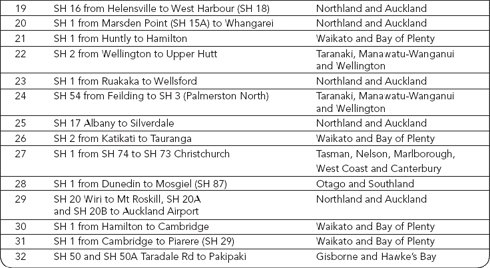
National Ranking
Collective Risk
The table below shows the national ranking for the links described as having high Collective Risk.
Personal Risk
The table below shows the national ranking for the links described as having high Personal Risk.
Related Links