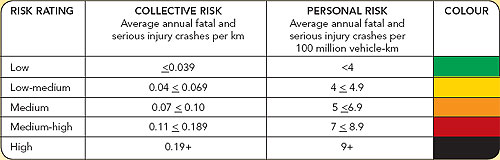
How are the various levels of risk defined?
The bands for the different risk levels were determined for the first production of KiwiRAP Risk Maps (2008) by spreading the number of links equally over the five risk categories.
Many of the higher collective risk links are in the higher populated, higher volume regions (such as the upper North Island regions) where the state highway network is also more dense with shorter road links.
Conversely, some of the higher personal risk lengths are in the less populated and less dense road network areas with longer road links required to meet the required minimum number of crashes criteria.
As a result, the higher collective risk links typically are shorter than the higher personal risk links resulting in less kilometres in the higher collective risk bands than in the higher personal risk bands.
The risk thresholds for the bands remained the same between 2008 and 2012 in order for comparisons to be made between the first Risk Maps (covering crashes in the 2002-2006 period) and the 2012 Risk Maps for the 2007-2011 period.
Related Links